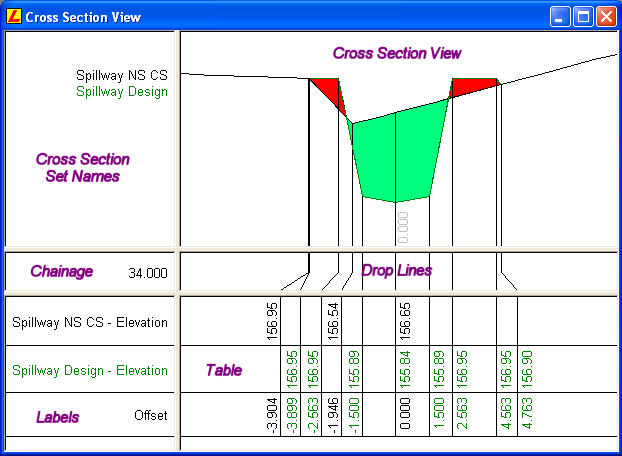
Selecting the Window/New/Cross Section View command creates a new cross section view of the currently open data base.
Cross Section Window Format
The Cross Section Window is split into 2 columns and 3 rows.

| View | Used to |
| Cross Section View: | Displays cross sections Cross Sections will be displayed in the colour and line style as set in the Cross Section Parameters dialog. Specific points on the section are related to the displayed information in the table view by means of vertical lines (drop lines). The Fit, Pan, Window, Zoom In, and Zoom Out commands can be used to change the display of the section. For all displayed points, the user has the option to display their, symbols, identifiers, descriptions, and codes. Vertical exaggeration can also be applied to the section by selecting the Display/Vertical Exaggeration command. A horizontal and vertical grid can also be displayed in this view. To configure the grid interval, select the Display/Features command and select the layout tab. Colours can be defined for all displayed components in the Configure Colours dialog. |
| Cross Section Set Names | Displays the names of the cross section sets. |
| Drop Lines | Displays the drop line connections between the cross section view and the table. |
| Chainage | Displays the chainage at the currently displayed cross section. |
| Table | Display rows of information relating to the displayed cross sections. |
| Labels | Display the labels of the information that is shown in the table. |
For more information regarding the display options available for this window, refer to the Display Features: Cross Section View help topic.