Using predefined drawing templates and data in your model you will complete two plans using the CAD module.
You will learn how to:- Create a CAD drawing using a drawing template
- Group drawings in a sheet set
- Display model data to scale in a drawing using a viewport
- Configure the objects displayed in the viewport
- Block out data in a viewport
- View the extents of the viewport in the model view
- Add and modify CAD objects in a drawing
- Annotate a drawing
- Plot drawings in a project
It is recommended you complete the Customise a Drawing Template tutorial prior to this tutorial.
Feature Plan 25 minutes
Subdivision Plan 75 minutes
Open a Project
- Click
 to access the File menu.
 - Click Open, then navigate to Documents\Tutorial Data and select 'Plan Data.neo'.
- Click Open.
The project includes:
- model data prepared for a feature plan
- model data prepared for a subdivision plan
- a drawing with an almost complete feature plan
The project opens with a model view displaying objects to be included in the feature plan.
For the feature plan, contour lines were generated and annotated, symbols were sized using attributes and features were annotated using text styles. Layers containing objects to be used in the feature plan have been added to a layer group named 'FEATURE PLAN'.
You will complete the feature plan and then create a subdivision plan using a predefined drawing template.
Feature Plan
Display the Drawing
-
On the ribbon CAD tab, in the Drawing group, click
Views.
There is one drawing in the project named ‘Feature Plan 2345’.
-
In the Manage Drawing Views dialog, click
, to view the drawing in a drawing view.
Keep the dialog open.
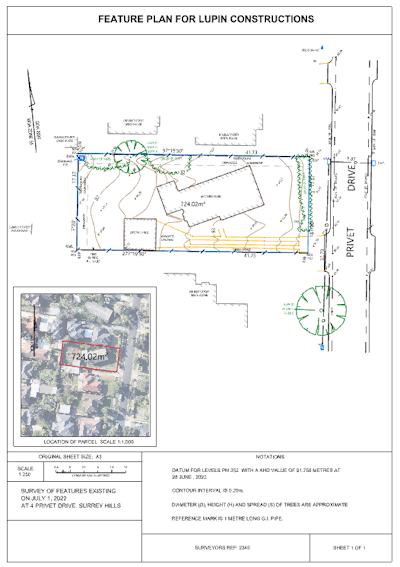
This drawing was created using the ‘Feature Plan – A3 Portrait’ drawing template. It includes a viewport into the model data, CAD objects and text, some of which are linked to project attributes or drawing properties. Notice the sheet numbers are blank in the bottom right corner of the drawing sheet.

This text is linked to the sheet set number. A sheet set has not yet been specified.
Create a Sheet Set
As the intention is to have more than one plan type in the project, you will specify a sheet set to ensure the feature plan sheets are numbered independently to the subdivision plan sheets.
-
In the Manage Drawing Views dialog, click in the Sheet Set column, then type Feature Plan.
The first drawing in the sheet set ‘Feature Plan’ will be numbered using the 'Sheet Number' value and numbers will increment for each new drawing in the sheet set.
-
Click the Sheet Number column, then type 1.

Each drawing in the project will have a unique drawing number even if it belongs to a different sheet set. -
Click Close.
The sheet number in the drawing is now updated.
Configure the Viewports
In the ‘Feature Plan 2345’ drawing, model data is displayed in 2 viewports. The viewports are windows into the model view. A viewport can display different layers and different objects than the model view. You can also specify how each layer’s objects are displayed in the viewport. Currently in the model view the lot boundary is drawn in blue and images are not displayed.
-
On the ribbon Home tab, in the Tools group, select the Attributes, Options and Layers checkboxes.
The Layers tool window lists the layers in the project. The Filter is displaying '<All Layers>' and the
icon shows the layers currently visible in the model view.
-
The rectangular box in the bottom left corner of the plan sheet is a viewport. Click inside the viewport bounds to select it.
You can use tentatively select to select viewports when they are overlapping. -
On the ribbon CAD tab, in the Viewport group, click
Edit to configure the currently selected viewport.
Editing a viewport allows you to change what is displayed in the viewport. Use it to pan, zoom, rotate or hide objects. You can also change how the objects are displayed. The Options tool window is renamed ‘Options – Viewport’ and now shows the display options for the selected viewport. While images are currently turned off in the model view, you will turn them on for this viewport.
-
In the Options – Viewport tool window, select the Images checkbox from the Features category.
The background image displays in the selected viewport but remains off in the larger viewport and in the model view.
When a viewport is in Edit mode, the Layers tool window is renamed to ‘Layers – Viewport’ and displays the layer settings for the currently selected viewport.
-
View the Layers – Viewport tool window.
The ‘Visible’ column indicates which layers are displayed in the viewport and if the layers visibility is connected to the visibility of the same layer in the model view.
If a layers visibility is disconnected from the model view, (
) turning the layers on or off in the model view will not have any impact on what is displayed in the viewport.
- Click the Visible column until the 4 visible layers display at the top of the list.
-
In the
 column, double click the EXISTING LOT BOUNDARY layer then in the Layer – Viewport dialog, click the Colour box from the Line category. Select
  and pick Red
  (FF0000) from the colour palette.
-
Click OK.
The ‘EXISTING LOT BOUNDARY’ now displays
in the 'Display' column.
For the selected viewport, all lines with a ‘By Layer’ colour on the EXISTING LOT BOUNDARY layer will now be drawn in red, even though in the model view the same line is drawn in blue.
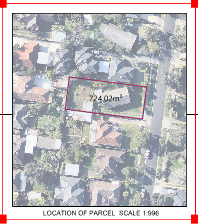
The display options for the layer in the viewport are now disconnected from the display options for the same layer in the model view. This means any changes to how objects in the EXISTING LOT BOUNDARY layer are displayed in the model view will not be reflected in the viewport.
You can click Reset, to resynchronise the layer display with the model view. - On the ribbon, in the Viewport group, click
Edit to exit the viewport edit mode.
-
As objects in the model may be dimensioned in ground or plan units, the ‘Plan Unit Scale’ is used to determine an equivalent size in ground units for text, images, symbols and line thickness configured in plan units. For example, if the Plan Unit Scale is configured to 1500, 3mm text, dimensioned in plan units is displayed at 4.5m in ground units. The Plan Unit Scale can be set for the model view and each viewport. For example, let’s look at the area text for the lot.
-
In the Attributes tool window, in the Viewport category, highlight 1000 in the Plan Unit Scale box, then type 1500 and press Enter.
The area text (which is configured to plan units) now displays larger in the smaller viewport. Note also that the size of the area text in the larger viewport has not changed.
The ‘View Scale’ (also a property of the viewport) is used to scale all model objects so that they are displayed at the desired scale in the viewport on the plan.
-
In the Attributes tool window, in the Viewport category, click in the View Scale box, click
 then select 1:1000 from the list.
A viewport scale of 1:1000 plots the 4.5m text in the example above with a height of 4.5 mm.
- In the Attributes tool window, in the Viewport category, select the Locked checkbox to prevent any further changes to the display of layers and layer properties in the viewport.
- Select the larger viewport (Unique Id 3), then in the Attributes tool window, clear the Display Border checkbox so the border will not be printed.
- Select the Locked checkbox.
Orientate Text
Since the data in the larger viewport has been rotated to best fit the drawing sheet, the area text is on a slight angle. You will configure the text so that it will always appear horizontal in the drawing regardless of the rotation of the other data.
-
Click the Model view tab, then select the area text.

- In the Attributes tool window, in the Appearance category, select the Orientate to Drawing checkbox.
-
Click the Feature Plan 2345 drawing and note the area text is now horizontal.
You can create a text style that has the 'Orientate to Drawing' checkbox selected.
Create and Configure North Points
A north point block object is included in the 'Feature Plan - A3 Portrait' drawing template. It was originally created in the model view using lines, and text linked to project attributes. It has been defined in both millimetres and metres so that it can be used in either the model or a drawing. You will add an instance of the north point block into the drawing for the data in the smaller viewport and rotate the existing block in the larger viewport to align it with the rotated data.
- On the ribbon CAD tab, in the Layer group, click the Active Layer box, then select NORTH POINT from the list.
- On the ribbon, in the Draw group, click
Block.
- In the Block Definitions dialog, select the North Point mm block, then click OK.
-
Click within the bounds of the smaller viewport to place the block.
The north point block is in the same location spatially as the viewport however it not part of the viewport. It is an object of the drawing. The NORTH POINT layer’s draw order is configured to be after the PLAN FORM VIEWPORT layer to make sure the model data displayed in the viewport does not obstruct the north point. - On the ribbon, in the Select group, click
Select, to exit block insertion mode. The inserted block is selected.
-
In the Attributes tool window, select the Scale Uniformly checkbox from the Appearance category then highlight the value in the Scale X box and type 3 and press Enter.
The Scale Y box is automatically updated.
- On the ribbon, in the Modify group, click
Move.
- Click on the North point anywhere but on the grip tags, then drag the north point to an appropriate location within the viewport’s boundary.
-
On the ribbon, click
Select, then select the larger viewport.
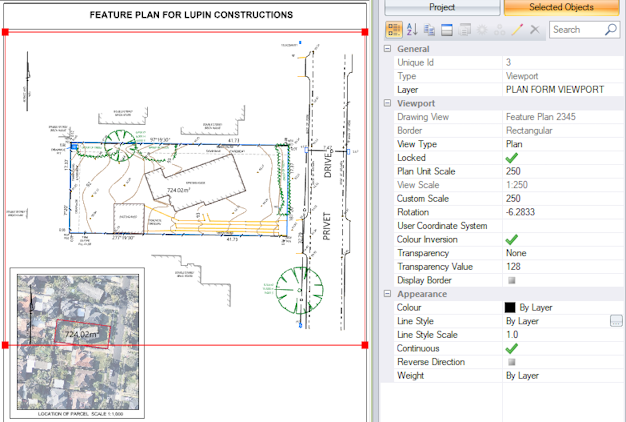
- In the Attributes tool window, in the Viewport category, highlight the Rotation value of the viewport data, then press Ctrl+C to copy the value.
-
Click the north point for the larger viewport to select it, then in the Attributes tool window, highlight the block’s Rotation value, then press Ctrl+V to paste the value and then press Enter.
The north point is now orientated in the same direction as the viewport data.
You could place a north point block in the model and display it with the viewport data. The block would then be automatically rotated and scaled with the other viewport objects. Notice the north point refers to MGA Zone 55. This value is from the ‘MGA Zone’ project attribute. Changing the zone in the project properties will update the value in north point. Also, the ‘Datum GDA’ project attribute, which is currently blank, is used to label the north point. Similarly, there are other values in the drawing templates that will be updated when project attributes or drawing properties are updated. You saw this earlier with the Sheet Number.
Insert Values for Project Attributes
|
You will insert a value for the datum, then see how this value automatically updates the north point blocks.
|
|
Create a Subdivision Plan
Data has been prepared in the model for the subdivision plan. Objects were annotated using text styles, text rules were used to annotate the boundaries, and additional text was added for enlargements. Different line thicknesses were used for boundaries and hatching was added to building polygons.
You will now create a subdivision plan using the prepared data. To do this, you will create drawings using a subdivision drawing template. To learn how to create your own customised drawing template see the Customise a Drawing Template tutorial. Subdivision data has been placed into layer groups called 'SUBDIVISION PLAN' and 'SUBDIVISION ENLARGEMENT'.
Display the Model Data
- Click the Model view tab.
-
In the Layers tool window, click the
menu, then select Auto Isolate.
This setting turns on all layers from the layer group you select and turns off all other layers.
- Click the Filter box, then select SUBDIVISION PLAN from the list to view the subdivision data.
-
On the ribbon CAD tab, in the Drawing group, click
Templates.
A list of drawing templates in the project displays in the ‘Manage Drawing Templates’ dialog. Notice that the 'Plan for Certification – Front' drawing template is part of a sheet set named 'Subdivision'. There are two other drawing templates that are also part of the same sheet set. A drawing created using one of these templates will be automatically part of the 'Subdivision' sheet set. The drawing sheet number will increment from the ‘Sheet Number’ (which is configured to 1) in the order the drawings are created.
You can use alpha numeric sheet numbers. - Click Close.
Create a CAD Drawing from a Template
-
On the ribbon CAD tab, in the Drawing group, click
 beside
 New, then click Plan for Certification – Front.
A drawing is created based on the selected template. It includes the linework and text for a cadastral plan form and commonly used text that you can insert into the form when required. As this text is outside the margins of the drawing sheet, it will not be printed or plotted.
Some of plan form text in the drawing template is linked to project attributes. This text updates when project attributes are updated. Most of the project attribute values required by the subdivision plan have been inserted. You will insert values for the remaining project attributes.
- In the Attributes tool window, click Project to display the project attributes.
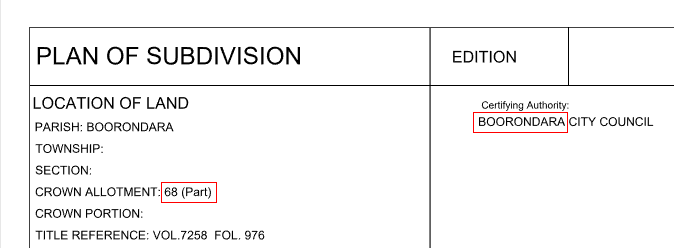
- In the Location of Land category, click in the Crown Allotment box and type 68 (Part).
-
Click in the LGA box, then click
 and select BOROONDARA from the list.
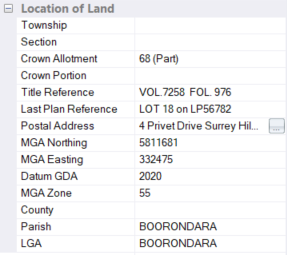
The values that you input for the project attributes are updated into the plan form.
Now you will create another drawing for the second sheet of the plan.
-
On the ribbon, in the Drawing group, click
 beside
 New, then click Generic Plan – Landscape.
A new drawing has been created based on the 'Generic Plan - Landscape' template.
The sheet number and other text objects linked to drawing and project properties have been updated automatically.
-
On the ribbon, in the Drawing group, click
Properties, the properties of the active drawing displays.
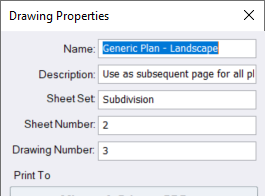
The Sheet Number is 2 since it is the second drawing created in the 'Subdivision' Sheet Set. The Sheet Number must be unique within the 'Subdivision' sheet set.
The Drawing Number is 3 since there is currently 3 drawings in the project. The Drawing Number must be unique for all drawings in the project.
- Click OK.
Create and Edit Viewports
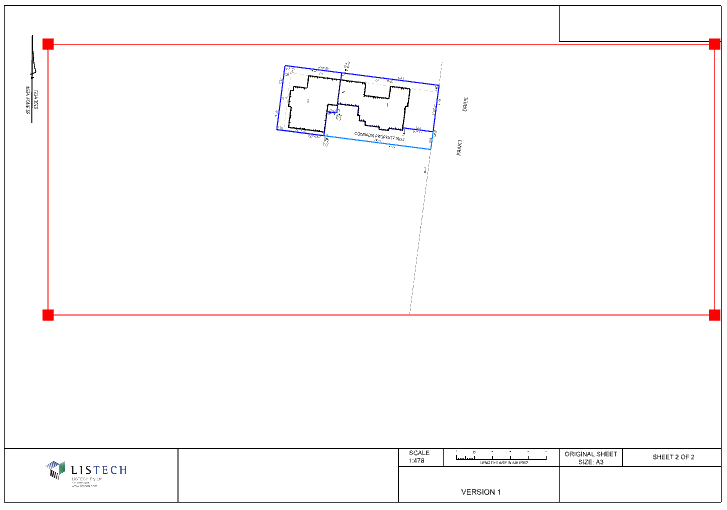
The rectangular box in the drawing is a viewport.
- Click inside the viewport bounds to select it, then on the ribbon, in the Modify group, click
Move.
-
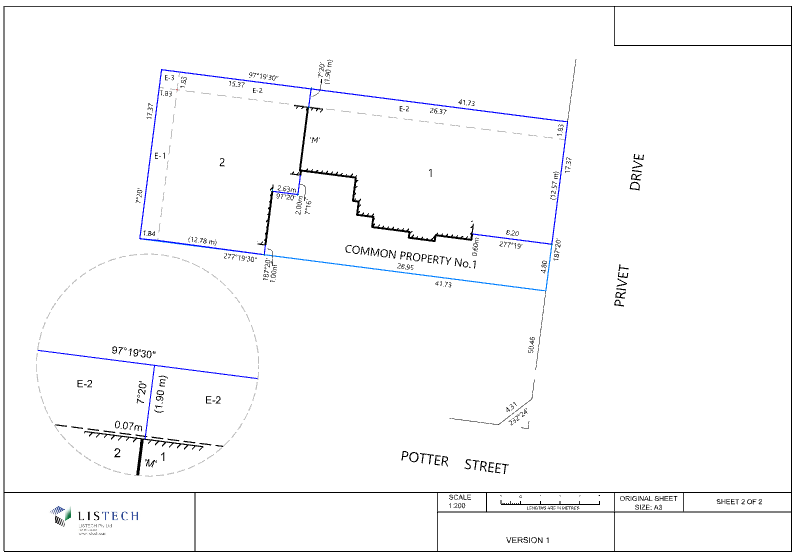
Click an edge or corner grip, then click the new location to resize the viewport. Continue to use the grips to resize the viewport so that your viewport is a similar size and in a similar location shown in the diagram below.
- Click
Move to exit the move mode.
- On the ribbon, in the Viewport group, click
Edit.
-
On the ribbon, in the View group, click
Fit, to fit the model data into the viewport.
View tools apply to the viewport when a viewport is placed in edit mode otherwise, they apply to the entire drawing view. 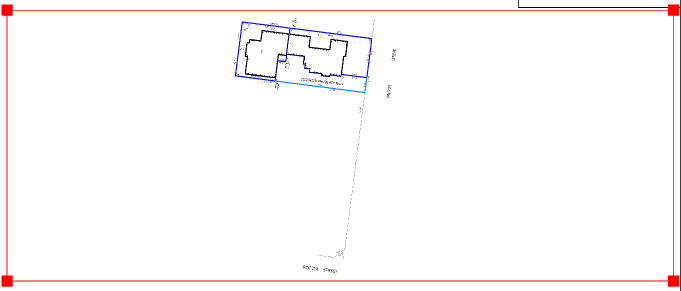
-
Use the mouse to zoom and pan in the viewport so that lots 1 and 2 are displayed at a similar size and location as the diagram below.
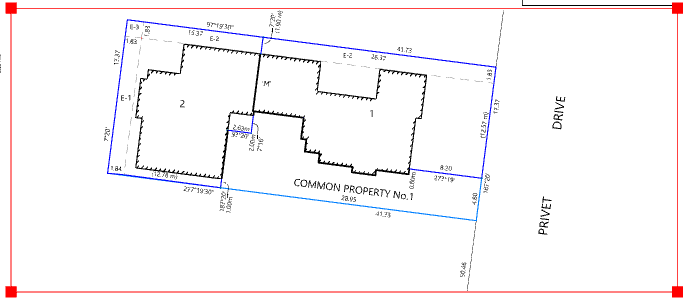
- In the Attributes tool window, click Selected Objects. The viewport's Custom Scale will be approximately 200.
-
Click in the View Scale box, then click
 and select the closest accepted cadastral scale, 1:200.
You will notice the scale text in the plan form updates to 1:200 because the template contained text linked to the viewports scale.

- If necessary, use the pan tool to move the data within your viewport.
- Click
Edit to exit the edit viewport mode.
- On the ribbon in the Layer group, click the Active Layer list and select PLAN FORM VIEWPORT.
- On the ribbon, in the Viewport group, click
New.
-
In the drawing, click the top left and bottom right locations of the second viewport so that the viewport is the same width and sits below the original viewport, with a small gap. The gap is required to show a break in the property connection line. The layers displayed in the viewport reflect the layers displayed in the model view at the time the viewport is created.
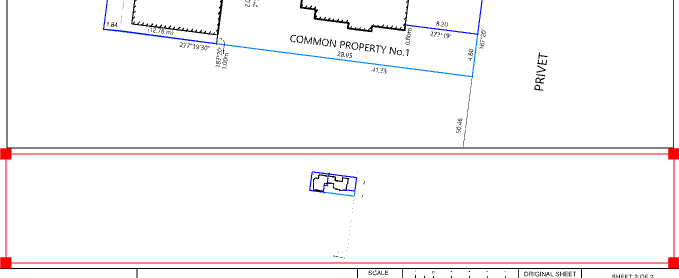
- In the Attributes tool window, click in the View Scale box, then click
 and select the same scale as the first viewport, 1:200.
 -
On the ribbon, in the Viewport group, click
Edit, then in the View group, click
Pan and move the viewport data to display the title connection on the corner of Potter Street and Privet Drive.
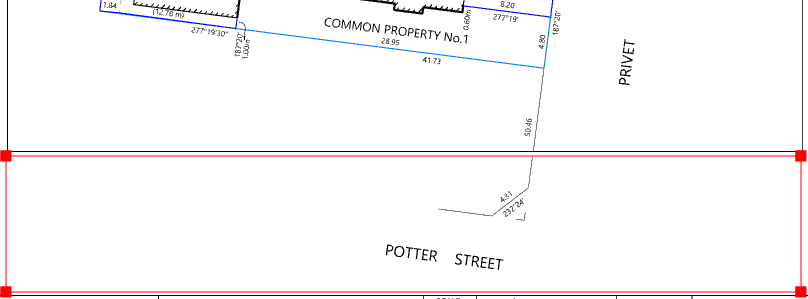
If you use the mouse wheel to pan, ensure the scale remains at 200. -
In the Layers - Viewport tool window, view the 'Visible' column.
The layers displayed in the model view at the time the viewport is created, are visible in the viewport. All layers have been automatically disconnected from the model at the time the viewport was created, indicated by
and
.
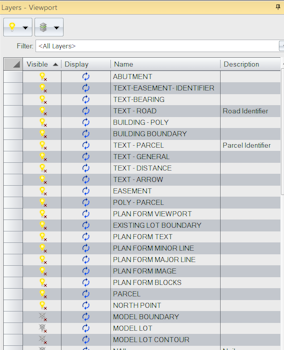
You can connect the layers to the model view if you want changes to a layers visibility in the model view to be reflected in the viewport.
Any new layers that you create or import will be automatically disconnected from existing viewports. -
On the ribbon, in the Viewport group, click
Edit to exit edit viewport mode.
You can use polygons to block out data you do not want on the plan. Polygons configured to be coloured ‘By Background’, will always display in the background colour regardless of the Colour Inversion setting. A polygon has been created in the model view to block out a section of the building boundary that is not needed for the plan.
- Click the Model view tab then in the Layers tool window, click the
menu and clear the Auto Isolate setting.
- Click the Filter box then select <All Layers>.
-
In the
 column, double click the WIPEOUT – SUB layer.
You will edit the layer so that it is displayed in the model view and grouped with other model data required for the subdivision plan.
- In the Layer dialog, click the Visible checkbox, then click the Groups tab, and click the SUBDIVISION PLAN and SUBDIVISION ENLARGEMENT checkbox.
- Click OK. A grey polygon displays in the model view.
-
Tentatively select the polygon, then when the correct polygon is highlighted, click to accept the selection.
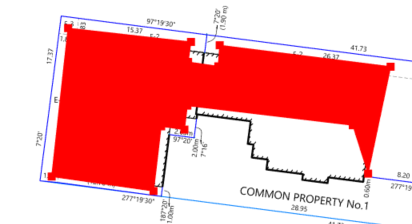
- In the Attributes tool window, click in the Fill Colour box, then click
 and select By Background.
 -
Click in the Edge Colour box, then click
 and select By Background, then click in blank space in the model view to clear the selection. Note that part of the building polygon is hidden by the ‘By Background’ polygon.
If you are using a polygon to block out data you do not require in your plan, you may need to change the drawing order for the layers to achieve the desired result. -
Click the Generic Plan – Landscape drawing.
The entire building edge is still visible in the top viewport. This is because the wipeout - sub layer is not visible in the viewport and is disconnected from the model view. If a layer is disconnected from the model view, changes to a layers visibility in the model view are not reflected in the viewport. To display the polygon in the top viewport you will turn the layer on for the viewport.
- Select the top viewport, then on the ribbon, in the Viewport group, click
Edit.
- In the Layers - Viewport tool window, in the 'Visible' column for the WIPEOUT – SUB layer, click
to make the layer visible in the viewport.
- In the Attributes tool window, click Locked to prevent the selected viewport from any further edits to the viewport’s layer visibility.
- Select the bottom viewport, then in the Attributes tool window, click Locked to prevent the selected viewport from any further edits to the viewport’s layer visibility.
-
On the ribbon, in the Select group, click
, None.
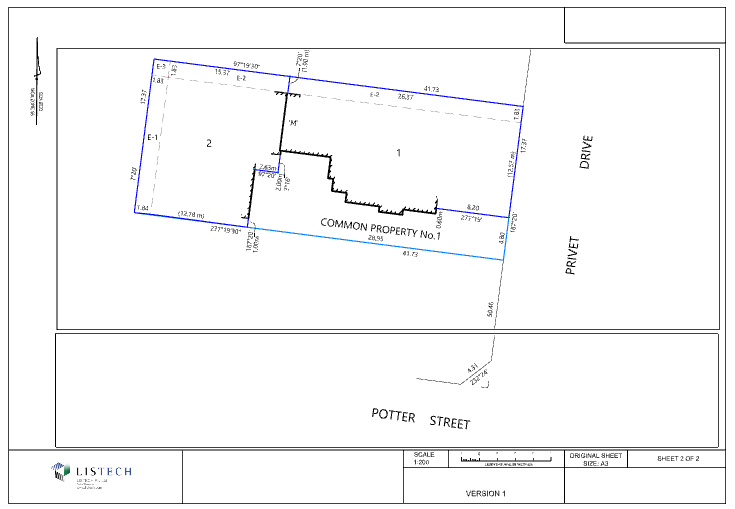
You will now create a third viewport that enlarges the data showing the clearance between the building and the easement. The annotations used for the subdivision in the first viewport are not suitable for the enlargement viewport because after scaling, they are displayed in a location that is outside the extents of the circular viewport. Additional text objects that link to model data have been created in the model to annotate the enlargement. These text objects have been placed on layers that are included in the layer group named 'SUBDIVISION ENLARGEMENT'.
- To quickly view only layers included in the ,'SUBDIVISION ENLARGEMENT' layer group, in the Layers tool window, click
, then click Auto Isolate.
- In the Layers tool window click the Filter box, then select SUBDIVISION ENLARGEMENT.
- Click the
menu, then clear the Auto Isolate setting.
- On the ribbon, in the Viewport group, click
 beside
 New and select Circular.
-
Click the location for the centre of the circle and then a location on the circle’s edge to create the circular viewport displayed in the diagram below.
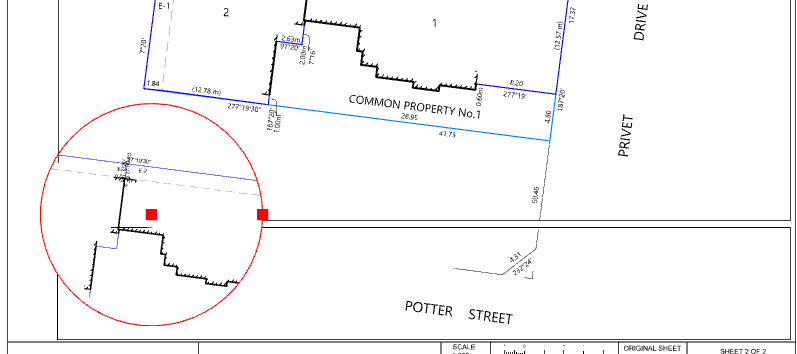
The borders for the first two viewports will eventually be turned off and will not display in the background of the third viewport.
Remember that you can use the Move tool to move and resize the viewport. -
In the Viewport group, click
Edit, then use the view tools to display an enlargement of the space between the E-2 easement and the building. In the Attributes tool window, view the updated Custom Scale. It should be approximately 50.
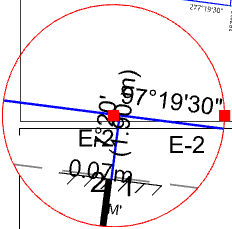
- Click in the View Scale box, then click the
 and select the closest scale, 1:50, from the list.
 - Click in the Plan Unit Scale box, type 50 then press Enter.
-
In the Viewport group, click
Edit, to exit edit mode.
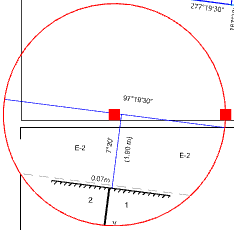
Some of the text objects in the circular viewport need to be rescaled or moved.
-
To rescale the text, in the Attributes tool window edit the Plan Unit Scale to 75 then press Enter.
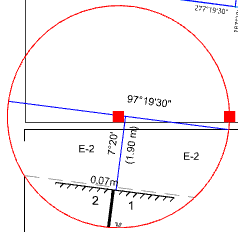
You will move the text objects in the model view.
| If your data does not fit in your viewport, you can use the move tool to enlarge your viewport. |
You will now create a second viewport to display the title connection.
Edit Viewport Objects in the model view
Before moving the text to a new location, view the objects from layers in the 'SUBDIVISION ENLARGEMENT' layer group in the model view using the same 'Plan Unit Scale' that you specified for the viewport.
- Click the Model view tab.
- In the Display pane of the Options tool window, in the Features category, select the Viewports checkbox to display the extents of the viewports in the model view.
-
In the Scaling category, highlight the Plan Unit Scale and type 75, then press Enter.
This changes the scale used to display text, symbols and line widths configured in plan units, in the model view to be the same as the enlargement viewport. Doing this allows you to review the location and size of text objects in relation to the line work as it will appear in the enlargement viewport.
- Use the mouse wheel to zoom and pan to the model data that is within the bounds of the circular viewport.
- Select the text 97°19'30", then on the ribbon Home tab in the Edit group click
Move Object(s).
- Click the new location closer to the title line.
- Repeat for the easement labels ‘E-2’, the lot labels ‘1’ and ‘2’, and the offset between the easement and building until you are happy with the text location.
-
On the ribbon, in the Select group, click
.
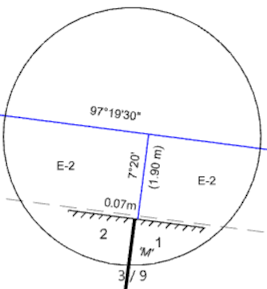
While the plan unit scale set for the viewport is suitable for most of the text the label ‘M’ is too small.
- Select the text ‘M’.
- In the Attributes tool window, in the Text category, click the Style box and select Plan Form 2.5 mm.
-
In the Appearance category, select the Italic checkbox, then on the ribbon, in the Edit group, click
Move Object(s) then move the selected ‘M’ text so that it clearly labels the building boundary and is within the bounds of the circular viewport.
- Click
Select to exit the Move Object(s) tool.
- In the Options tool window, highlight the Plan Unit Scale in the Scaling category and type 200 to return the plan unit scale for the model view back to the original setting.
-
Click the Generic Plan – Landscape drawing to see the texts changes reflected in the enlargement viewport.
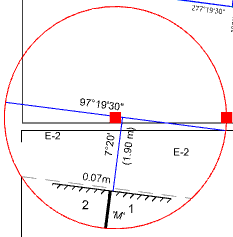
Configure a Viewport’s Layer Display Options
You will make the easement line more pronounced just for the circular viewport.
- With the circular viewport still selected, on the ribbon CAD tab, in the Viewport group, click
Edit.
- In the Layers – Viewport tool window, double-click the Easement layer in the
 column, then in the Line category, click the Colour box, then click
  and pick
  black (#000000).
 - Click
 in the Line Style box, then in the Line Style dialog, select line style L045 (Easement 2), then click OK.
 - In the Weight box, select 0.4 mm, then click OK.
On the ribbon, in the Viewport group, click
Edit to exit edit viewport mode.
Configure the Viewports Borders
You can leave the selected viewport border displayed but you will change the appearance of the border to be less prominent.
- On the ribbon, in the Layer group, click
Edit to edit the active 'PLAN FORM VIEWPORT' layer then click the Display tab.
- Click the Type box then select Viewport.
- Click in the Colour box in the Appearance category, then click
 and select
  (#BEBEBE) from the colour palette.
 -
Click
 in the Line Style box, then in the Line Style dialog, select
  (L045) (Easement 2) from the list. Click OK twice.
The remaining two viewport borders have also been updated however they are not required for the plan.
-
On the ribbon, in the Select group, click
None. Select the first and second viewport, then in the Attributes tool window, clear the Display Border checkbox in the Viewport category, then click in the drawing view background to unselect the viewports.
Create CAD Objects
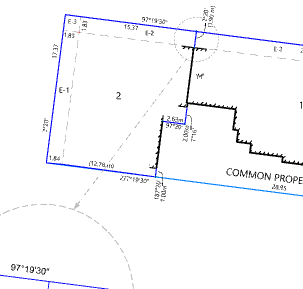
You will create a line showing the location of the enlargement in the main diagram and then you will create an arrow for this line. First, you will setup the display options for the layer that the CAD objects will be created on.
- In the Layers tool window, click the Filter box, then select SUBDIVISION PLAN.
- On the ribbon CAD tab, in the Layer group, click the Active Layer box, then select EASEMENT.
- Click
Clone to make a copy of the 'EASEMENT' layer.
- In the Layer dialog, type CAD OBJECTS in the Name box, then click the Display tab.
- Click the Type box, then select Point from the list.
- Click the Colour box, then click
 and pick
  (Gray or #808080) from the colour palette.
 - Click
 in the Plan Symbol box, then scroll down to the end of the list and select the solid arrow (S201) from the symbol list. Click OK.
 -
Click in the Width box and type 3 then click OK.
Any CAD symbols created on this layer will use the specified arrow.
- To create a circle to show the location of the enlargement in the main plan, in the Draw group, click the
 beside
 Circle, then click 3 Radial Vertices.
-
Click 3 evenly spaced locations on the edge of the circular viewport.
The enlargements scale is 4 times as large as the first viewport, so the circle needs to be scaled by 0.25 to occupy the same space in the first viewport.
-
In the Modify group, click
Scale.
Instructions are displayed in the Status Bar when CAD objects are created or modified. - Click the centre of the circle you just created.
- Move the mouse until the scale in the status bar is approximately 0.25, then click to accept.
- In the Modify group, click
Move.
-
Click the circle you just scaled and drag it over the first viewport and place over the section of linework displayed in the enlargement viewport.

Alternatively, you could create a circle in the model using the viewport extents. You will now create an arrow pointing to the enlargement.
- In the Draw group, click
Straight.
- Click two locations in the drawing to draw a line from the circle you just created towards the enlargement viewport.
- On the ribbon, in the Draw group, click
Symbol.
-
Tentatively click the end of the line closest to the enlargement viewport, then click to accept. The default point symbol for the CAD OBJECTS layer is inserted.
The symbols vertex has been created in the same location as the end of the line but the two objects do not share a vertex. Moving the line will not move the symbol. - On the ribbon, in the Modify group, click
Rotate. Tentatively click the arrow to select the symbols insertion vertex then click to accept the vertex as the rotation origin. Move the mouse to rotate the symbol so that it points to the enlargement viewport.
-
Click
Rotate to exit Rotation mode.
-
On the ribbon in the Select group, click
.
Create Text
You will now annotate the CAD drawings using 5 methods:
- Adding new static text objects
- Adding new text objects that are linked to project properties
- Editing existing text objects
- Copying and pasting text from the drawing background
- Inserting a block with text
- On the ribbon CAD tab, in the Layer group, click the Active Layer list and select TEXT - GENERAL.
- On the ribbon, in the Draw group, click
Text, then in the Draw Text dialog, select the Default text style.
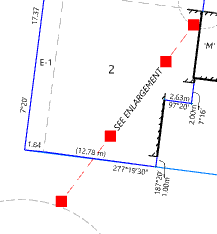
- Type SEE ENLARGEMENT.
- Click in the Rotation box, then click on the southern half of the line you just added to define the rotation. Using the mouse, place the text over the same line.
- On the ribbon, in the Modify group, click
Insert Gap.
-
Click the line either side of the ‘SEE ENLARGEMENT’ text.
- On the ribbon in the Draw group, click
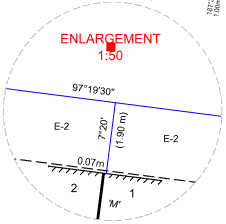
Text. In the Draw Text dialog, click in the Style list and select Plan Form 5.0 mm.
- In the text box, delete the SEE text, click at the end of the ENLARGEMENT text, then press Enter. Type 1: .
- Click
then in the Insert Linked Text dialog, select Scale, where the source is Viewport09 (which is the Unique id for the enlargement viewport), then click Insert.
-
Place the text at the top of the Enlargement viewport, then click Close.
A scale bar has been inserted into the plan form as part of the drawing template but you need to add the appropriate numbers for your scale.
- Use the mouse wheel to zoom in on the scale bar.
- Double-click the first asterisk in the scale bar, the Modify Text dialog opens automatically.
- Edit the value in the text window to 2, since 10mm is equivalent to 2 meters when using a 1:200 scale. Click OK.
-
Repeat for the other asterisks in the scale bar and type 2, 4, 6 and 8 respectively.

-
Click the Plan for Certification – Front drawing view to insert text into the first page of the plan.
When inserting text you can overlay a grid and use it to align text objects.
- On the ribbon, in the Draw group, click
 besides
 Grid, then select Settings to display the Grid Settings dialog.
- In the Display group, click the Interval box and type 5, then select the On checkbox, and the On Top checkbox.
-
In the Snap group, highlight the value in the Interval box, type 1, then select the On checkbox. Click OK.
A grid overlays the drawing at 5mm intervals. With snap configured to 1mm, any objects inserted into the drawing will snap to the mm.
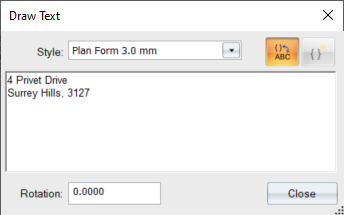
- On the ribbon, in the Draw group, click
Text, then in the Draw Text dialog, click the Style list then select Plan Form 3.0mm.
- Click
, then select Location of Land.Postal Address and click Insert.
-
Click
to display the text that will be inserted.
This is the postal address from the project attributes.
-
In the drawing, click the location of the text as shown in the diagram below, using the grid to vertically align the text.

- Click
, then highlight the text and type NIL.
-
Insert the text twice in the 'VESTING OF ROADS AND/OR RESERVES PANEL', then click Close.

- Double click the ‘Survey:’ Notations text This plan is/is not based on survey. In the text box of the Modify Text dialog, delete /is not. Click OK to update the text to ‘This plan is based on survey’.
- Double click the asterisk in the 'Easement Reference' column located in the EASEMENT INFORMATION section. In the text box of the Modify Text dialog, type E-1, E-3. Press Enter three times, type E-2, E-3 then click OK.
- Double click the asterisk in the 'Purpose' column. In the text box of the Modify Text dialog, type DRAINAGE AND SEWERAGE. Press Enter, type SEWERAGE, then press Enter twice. Type DRAINAGE AND SEWERAGE. Press Enter, type DRAINAGE, then click OK.
-
Continue to replace the remaining placeholders represented by asterisks, with text from the following easement table.

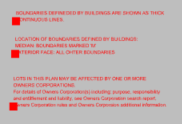
In your templates you can place text that you use often in the drawing background (outside the print area) and copy the text into your plan when applicable.
-
On the ribbon, in the Select group, click
Rectangle then draw a box to select the top 3 groups of text to the right of the drawing sheet in the drawing background area.
-
On the ribbon, in the Edit group, click
Copy, then click
Paste. Click in the Notations section on the right of the plan to paste the text.
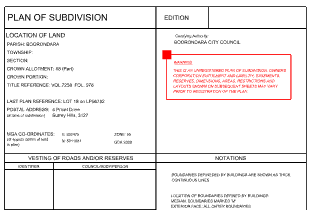
Commonly used text can also be added as blocks.
-
On the ribbon, in the Draw group, click
 beside
 Block then select Block Definition. Select the block named Warning then click OK. Click in the box below the LGA name to place the block of text.
- On the ribbon, in the Select group, click
to exit block insertion mode.
Insert the Plan Number
Once you have been allocated a plan number you can add a Plan Number project attribute then insert a value for this attribute and it will automatically update all the subdivision drawings since the templates you used to create the drawings contained text linked to the plan number.
- In the Attributes tool window, click Project, then click the Attributes category.
- Click
, then in the 'Create Attribute' dialog, click in the Attribute list then select Plan Number (Text) from the list.
-
Type PS981256A in the Value box, then click OK.
The plan number is updated in both the 'Plan for Certification – Front' drawing and the 'Generic Plan - Landscape' drawing.
Print the Plan
You can batch plot the plans to different files, printers, or plotters. First ensure Layers for all Drawings that you intend to print are turned on.
- In the Layers tool window, click
 to select all layers then click the
 menu and select On.
- Click the Filter list then select the FEATURE PLAN group.
- Click
 to select all layers then click the
 menu and select On.
-
On the CAD tab, in the Drawing group, click the
 besides
 Plot, then select Batch Plot.
You can see all drawings will be printed to a PDF file.
- Select all drawings then click
.
- Since all files are specified to print to the same printer, you are given the option to merge the files into one pdf file. Click Merge all drawings.
-
In the File name box, type a name for the file, then press Save.
All Drawings in the project are plotted in the order of their drawing number.
Only the data on layers set to plot is plotted.
You have now completed the tutorial and are ready to create your own plans from customised drawing templates. You should now be able to configure the display of layers and objects in a viewport, set a scale for your viewport, add and edit CAD objects, configure scales and north points and plot your plans.
If you have any questions please contact: support@listech.com.

